Jump to: Flourish templates | wbplot R package
Flourish templates
Flourish is a user-friendly tool to create and embed interactive data visualizations. World Bank styled Flourish templates are provided to allow for the creation of Flourish visualizations complying with this style guide.
Getting started
In order to use the templates, you need to have a paid license Flourish account with your World Bank email. If you don't have an account yet, go to flourish.studio and create your account with your World Bank email. For subscription to the paid license, please reach out to Elysee Kiti at ekiti@worldbank.org. After registration, log in to flourish.studio. Then you can access the World Bank templates by clicking the 'New visualization' button, and selecting 'By World Bank Group' in the sidebar when asked to choose a template.
Examples
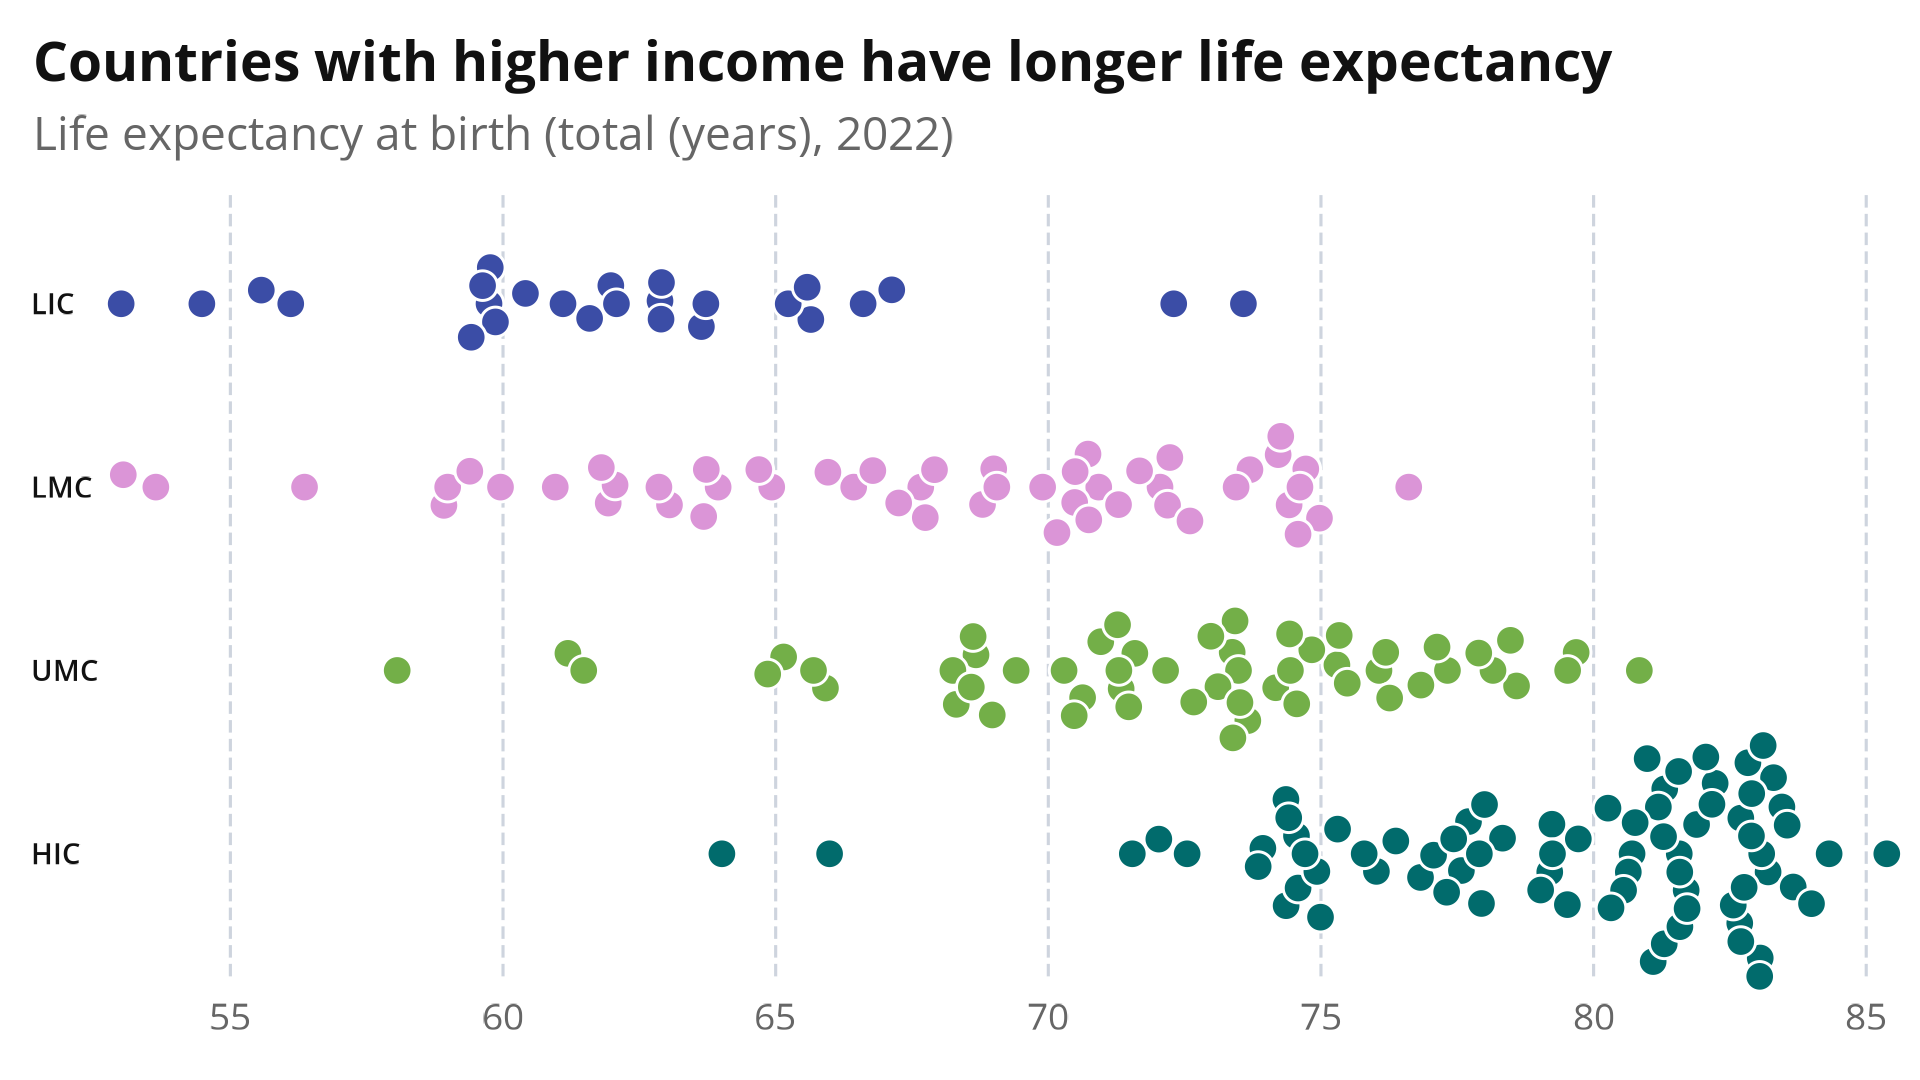
For now, the World Bank templates are limited to world tile grid maps (square and hexagonal), and bee swarm plots.
When more World Bank templates are developed, they will be added here. For now, you can make other visualizations than the tile grid maps and beeswarm plots by making duplicates of the visualizations in the Chart templates folder in your Flourish projects.
wbplot R package
ggplot2 is a widely used package for creating visualizations in R. The wbplot package contains a theme and other functions to apply the World Bank data visualization style to ggplot2 visualizations. You can find the theme at github.com/worldbank/wbplot.
Installation
The package is still under active development and is not yet available on CRAN. Installation instructions are provided in the readme here.
Using the theme
With the package loaded into your R session, you can add theme_wb() to your plot to style it. It will turn this...
p <- ggplot(data, aes(NY.GDP.PCAP.PP.CD, SP.DYN.LE00.IN, color = region_iso3c)) +

				  geom_point() +

				  scale_x_continuous() +

				  labs(title = "Richer countries have higher life expectancy",

				    subtitle = "GDP (per capita $ PPP) vs total life expectancy at birth (years)",

				    x = "GDP per capita",

				    y = "Life expectancy")

p 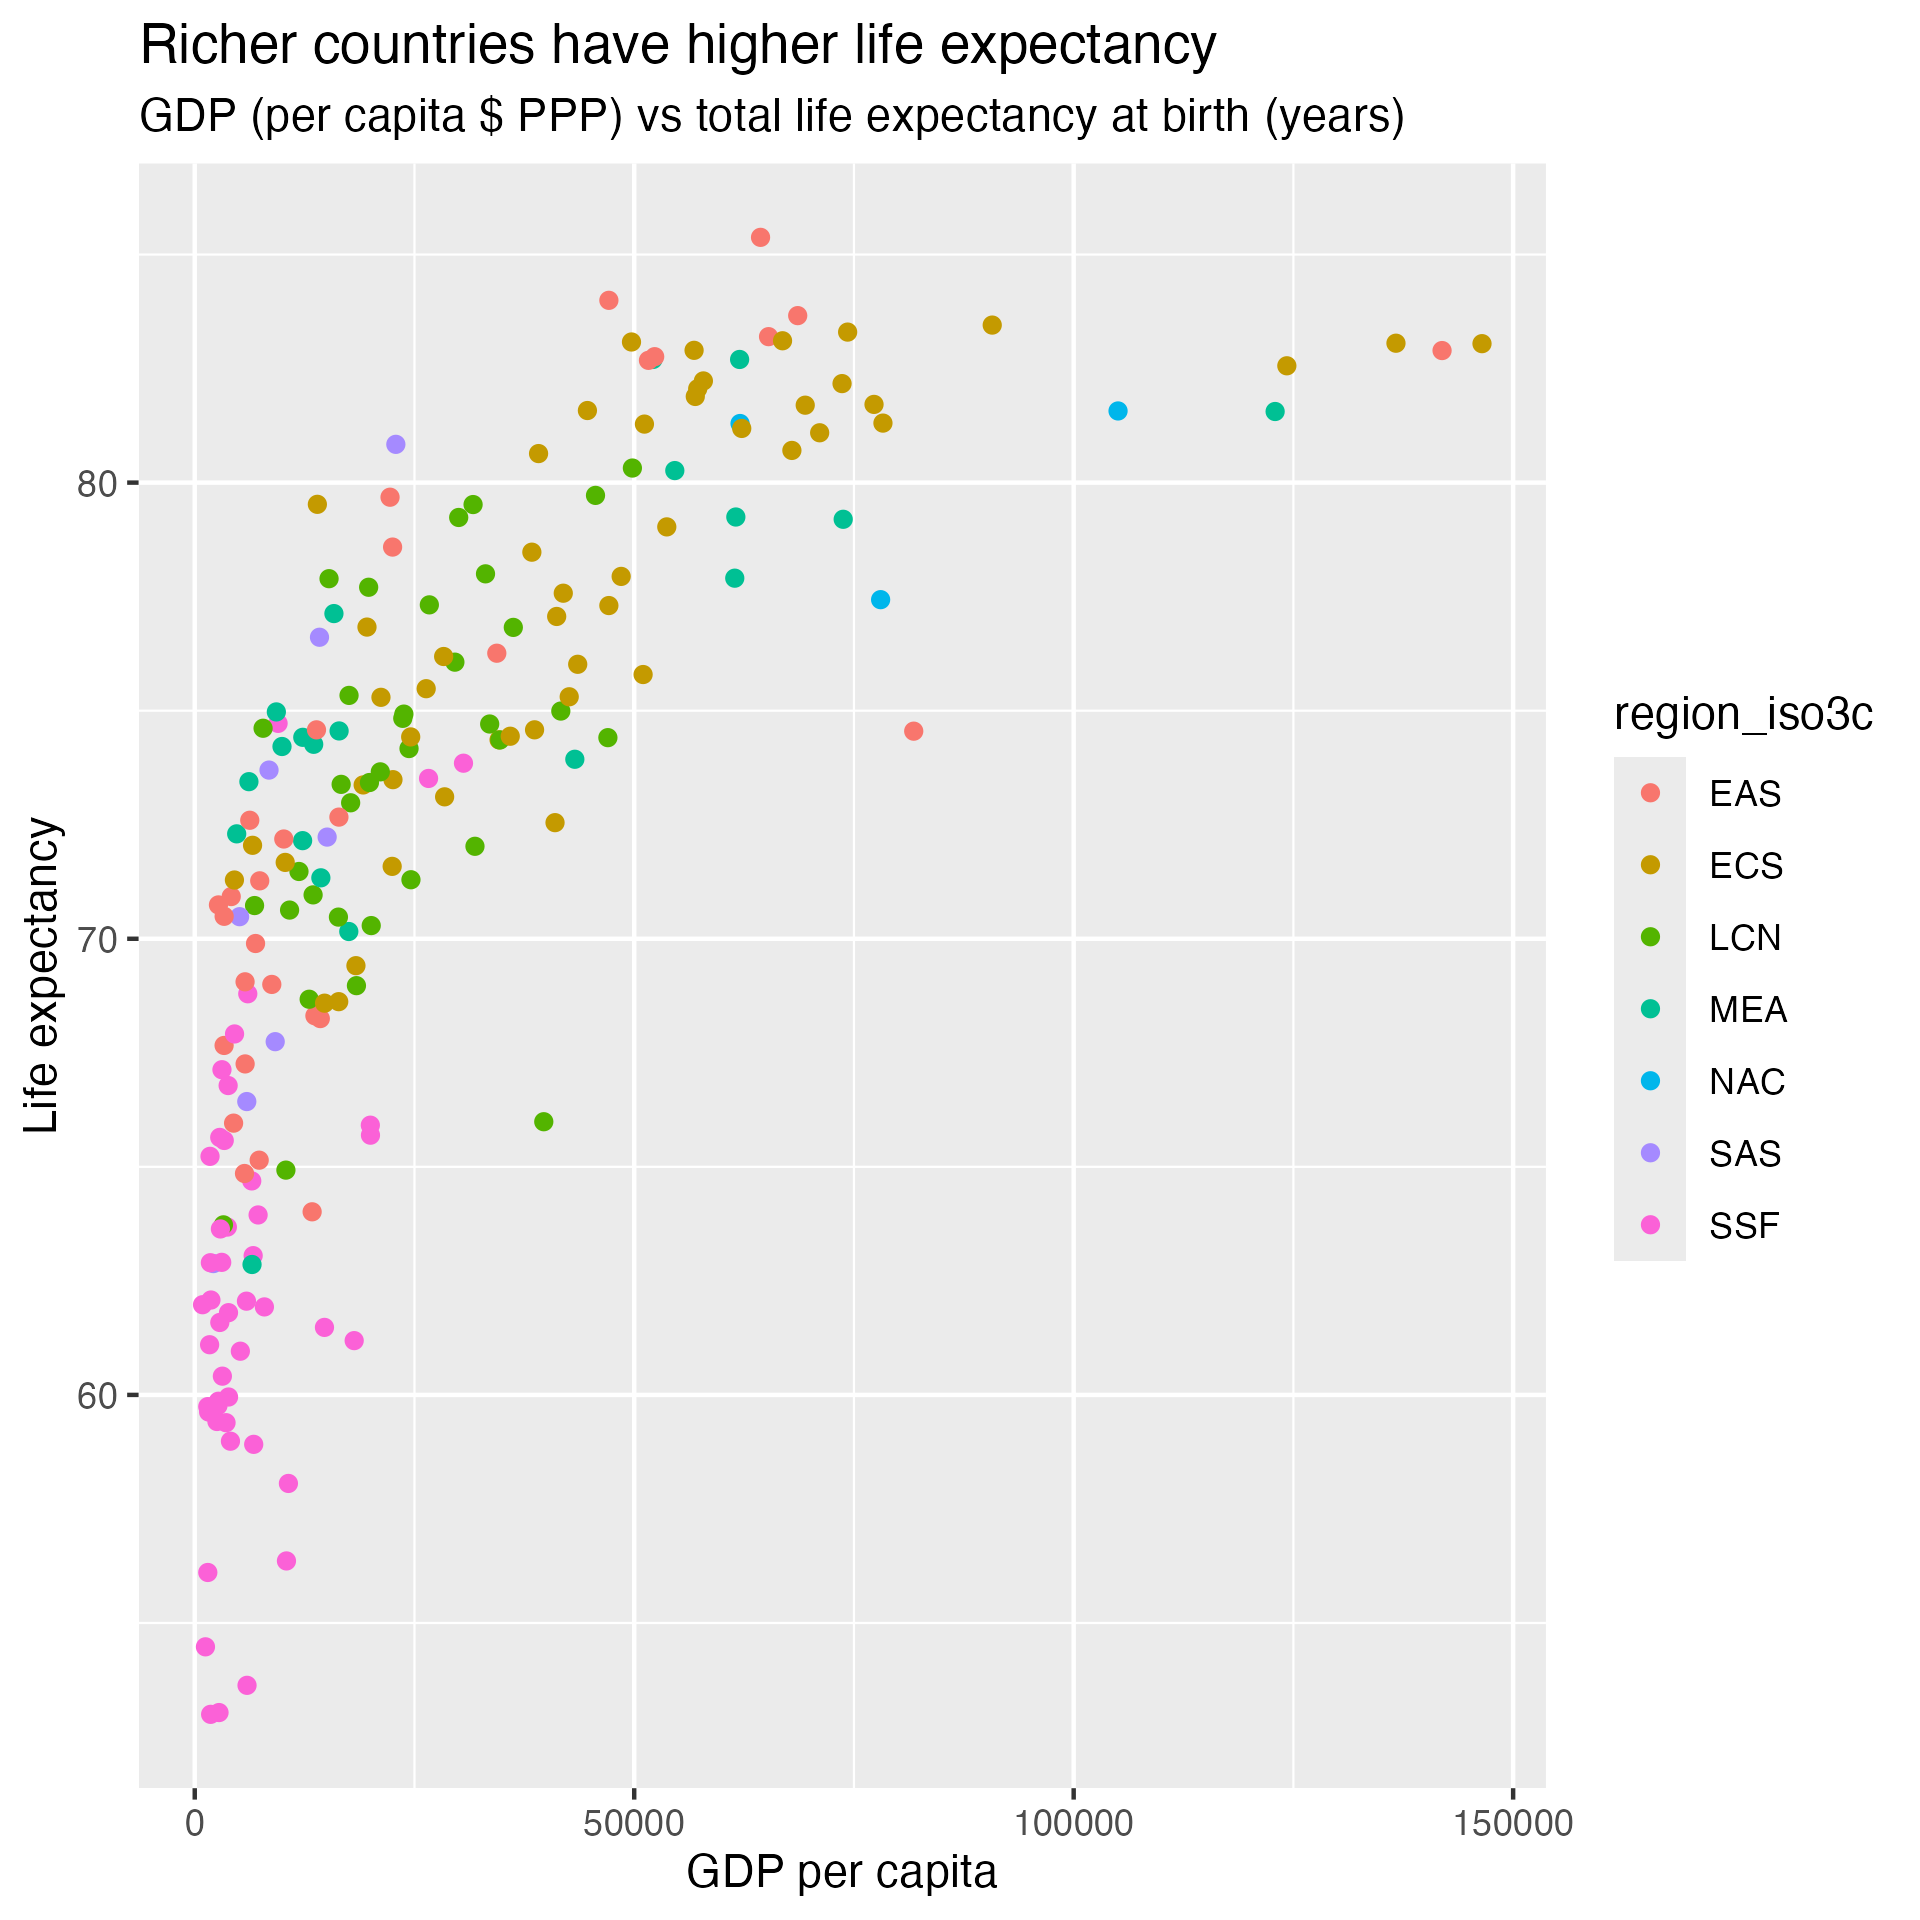
... into this:
p.wb <- p +

				  theme_wb(chartType = "scatter") +

				  aes(color = NULL, fill = region_iso3c) +

				  scale_fill_wb_d(palette = "region", name = "Region")

p.wb 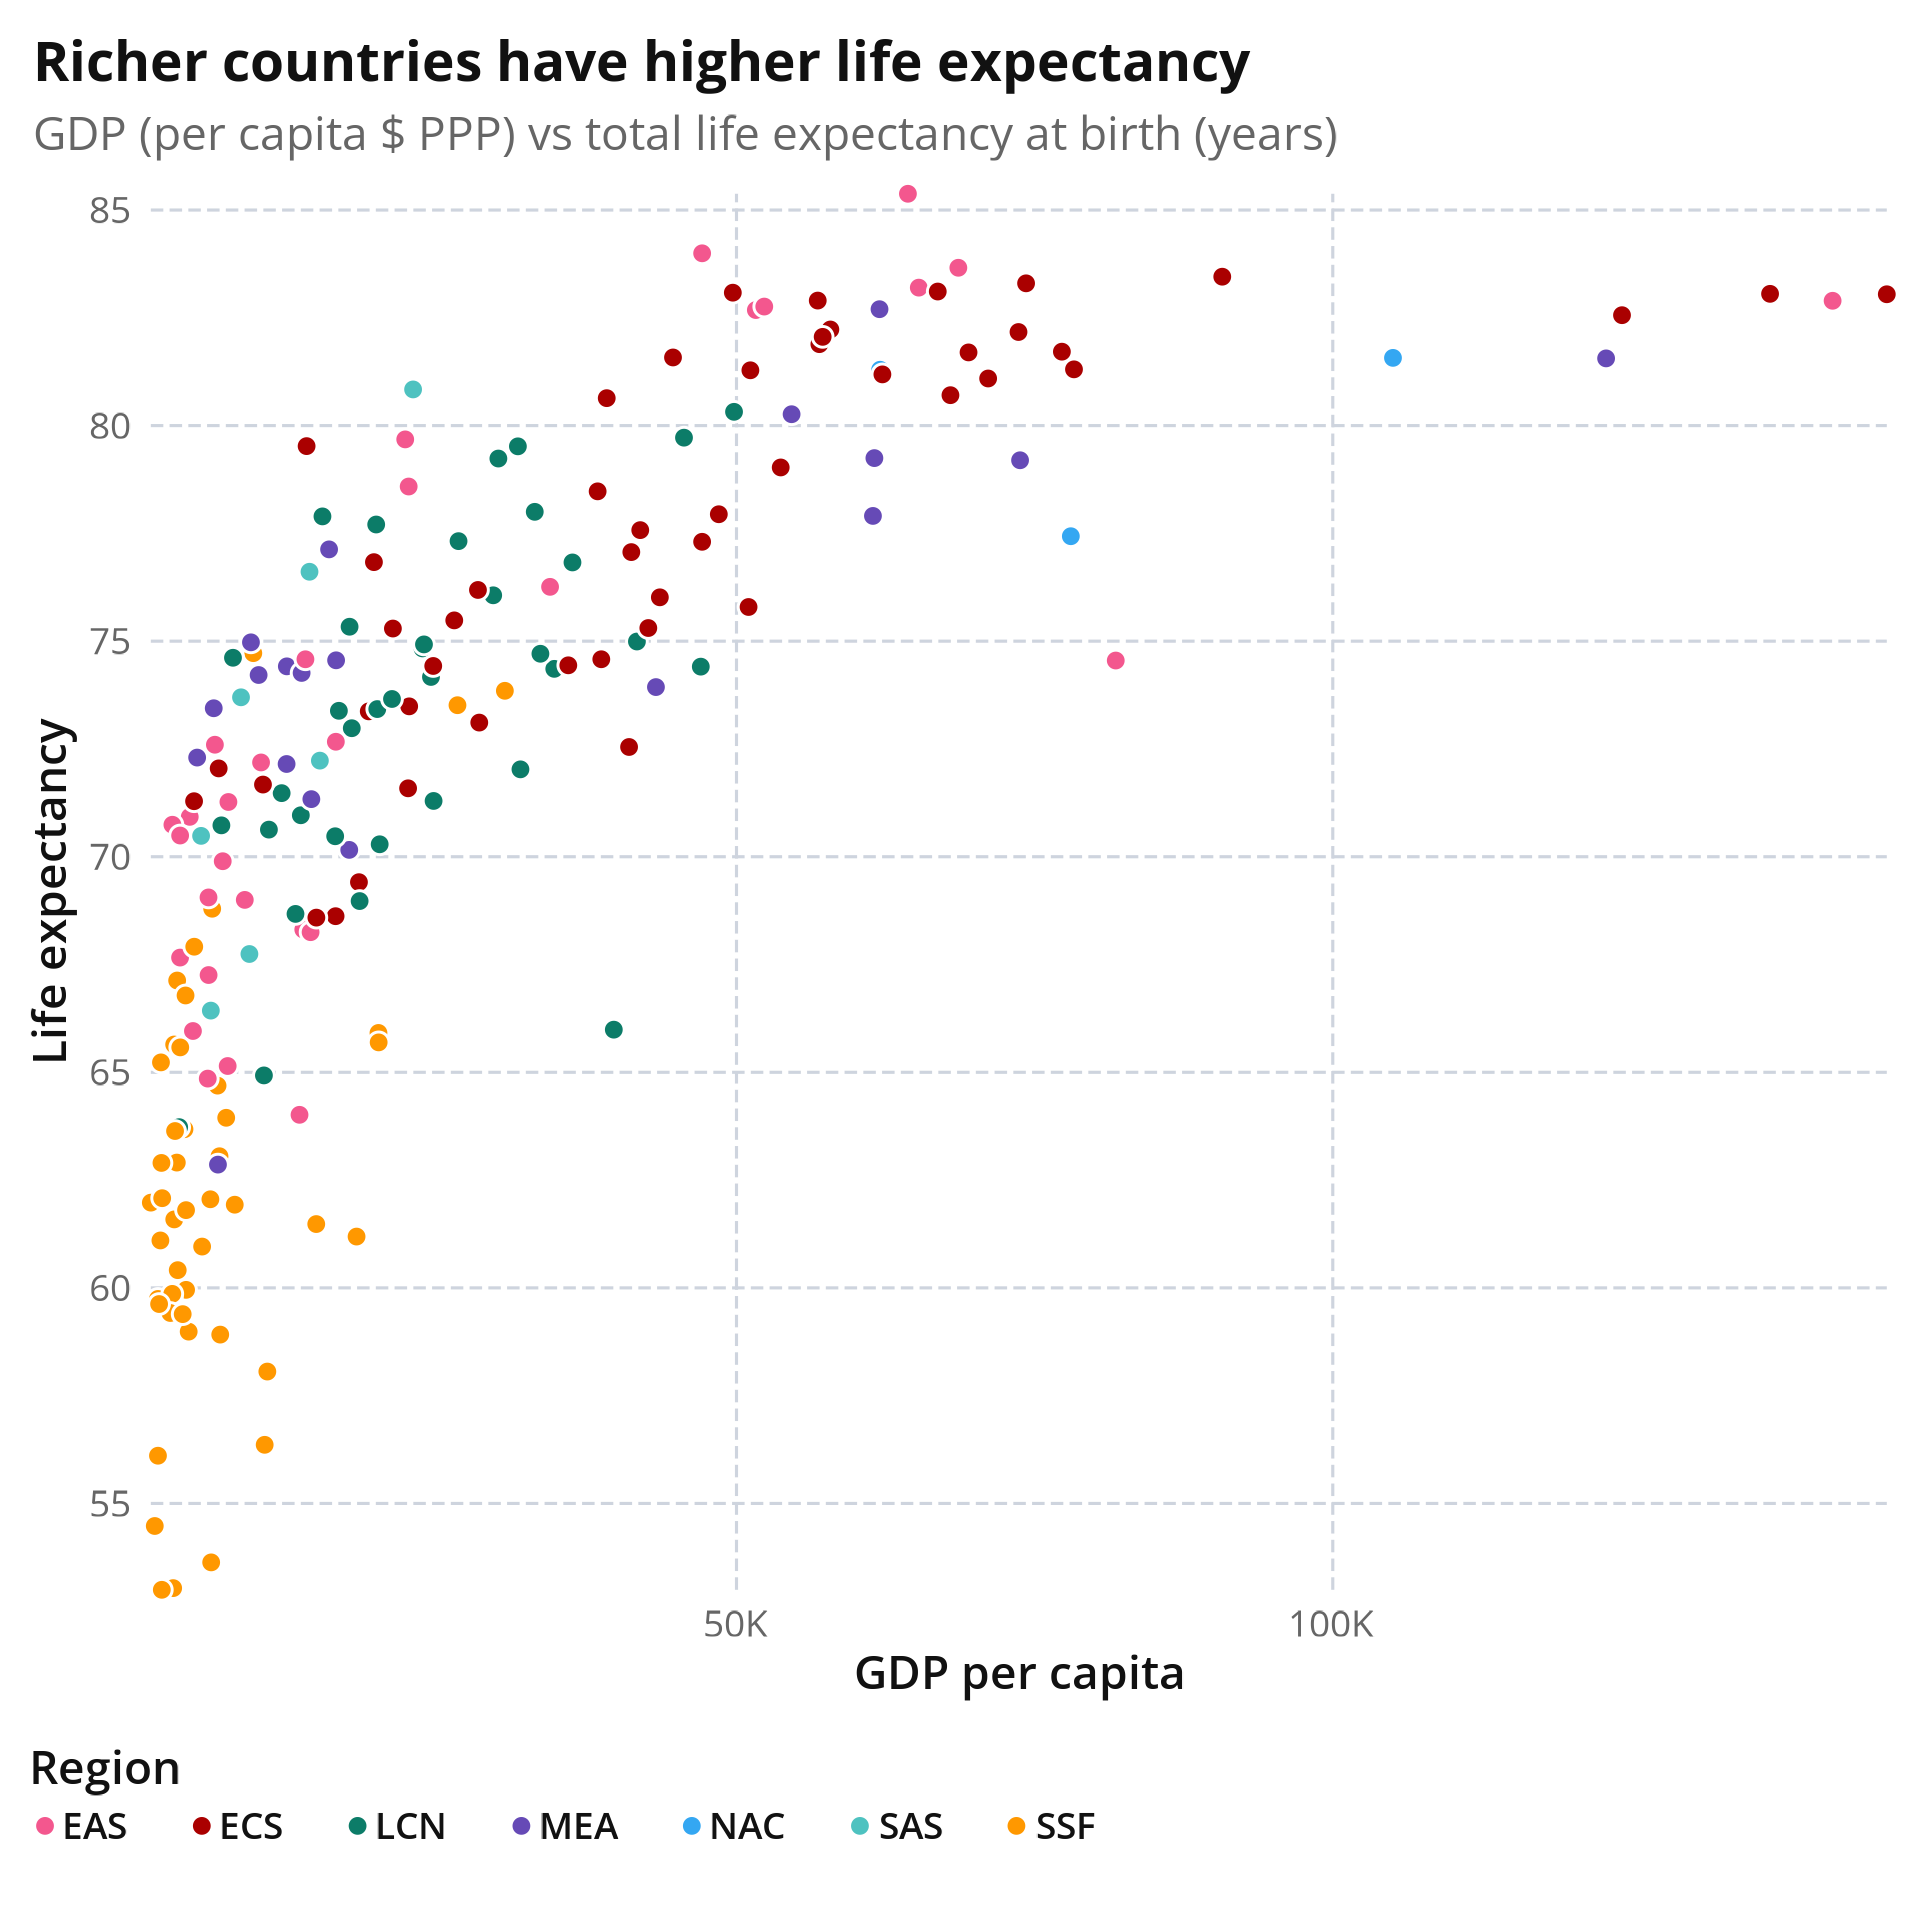
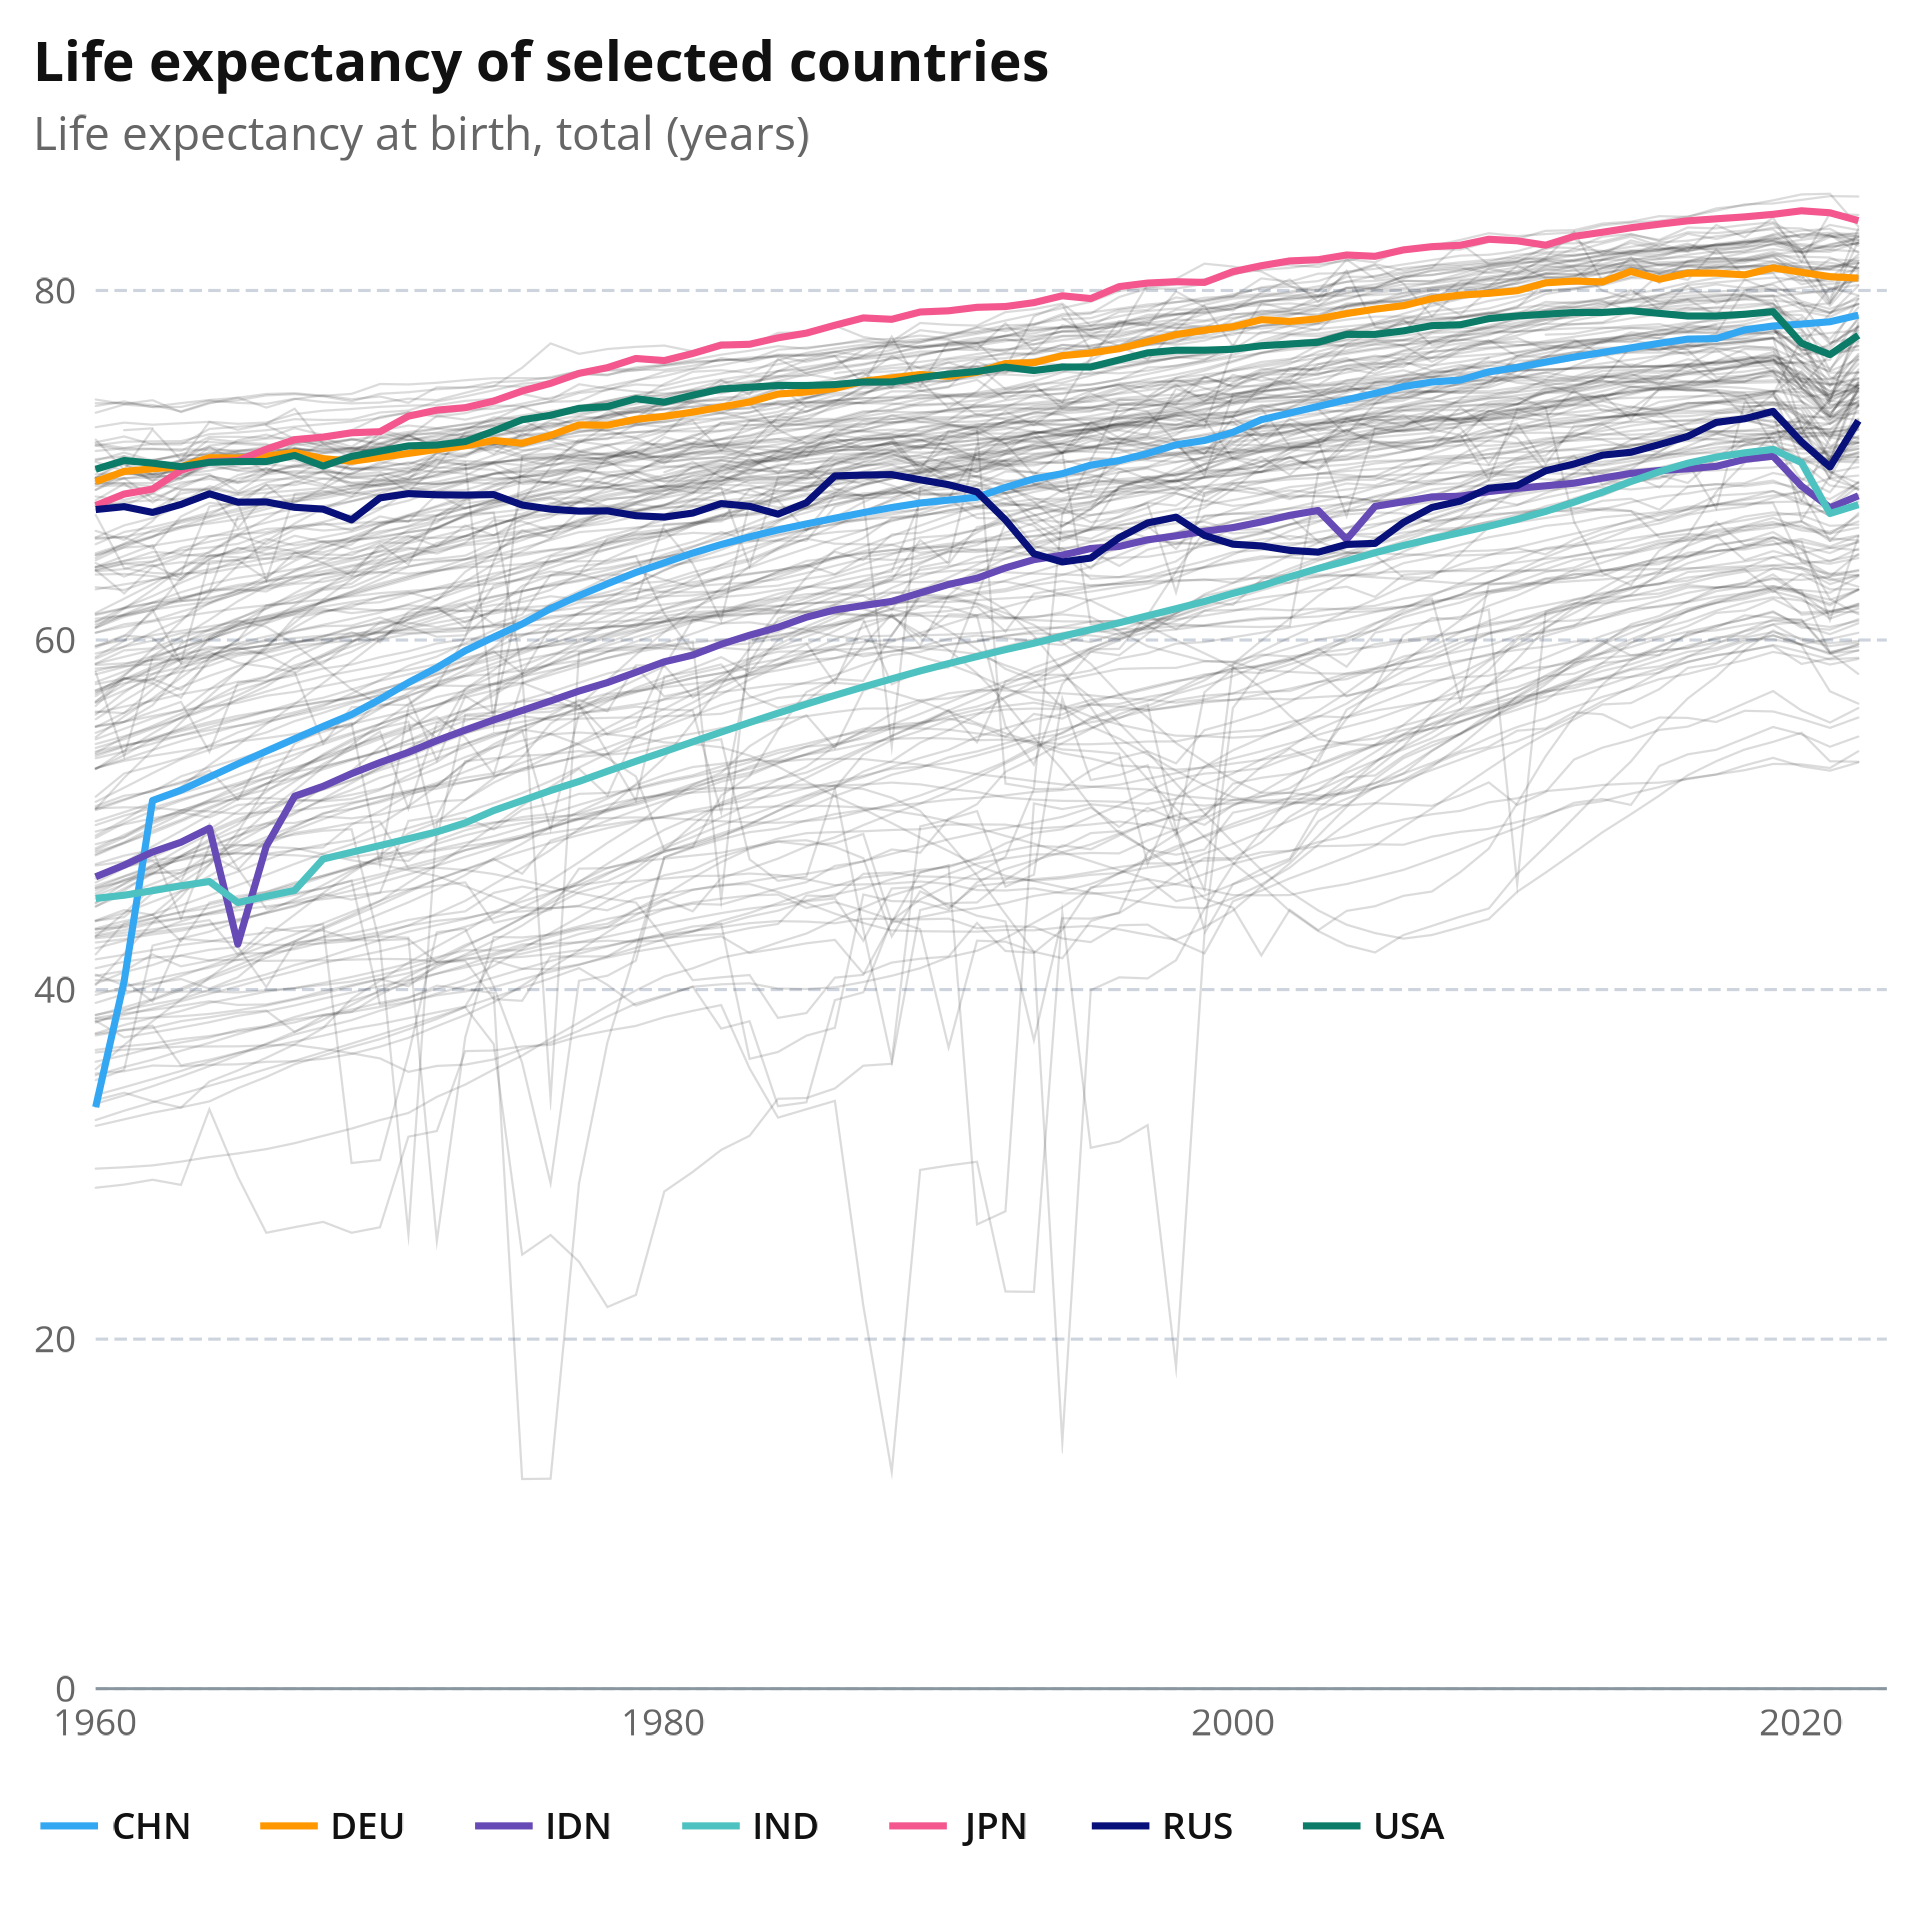
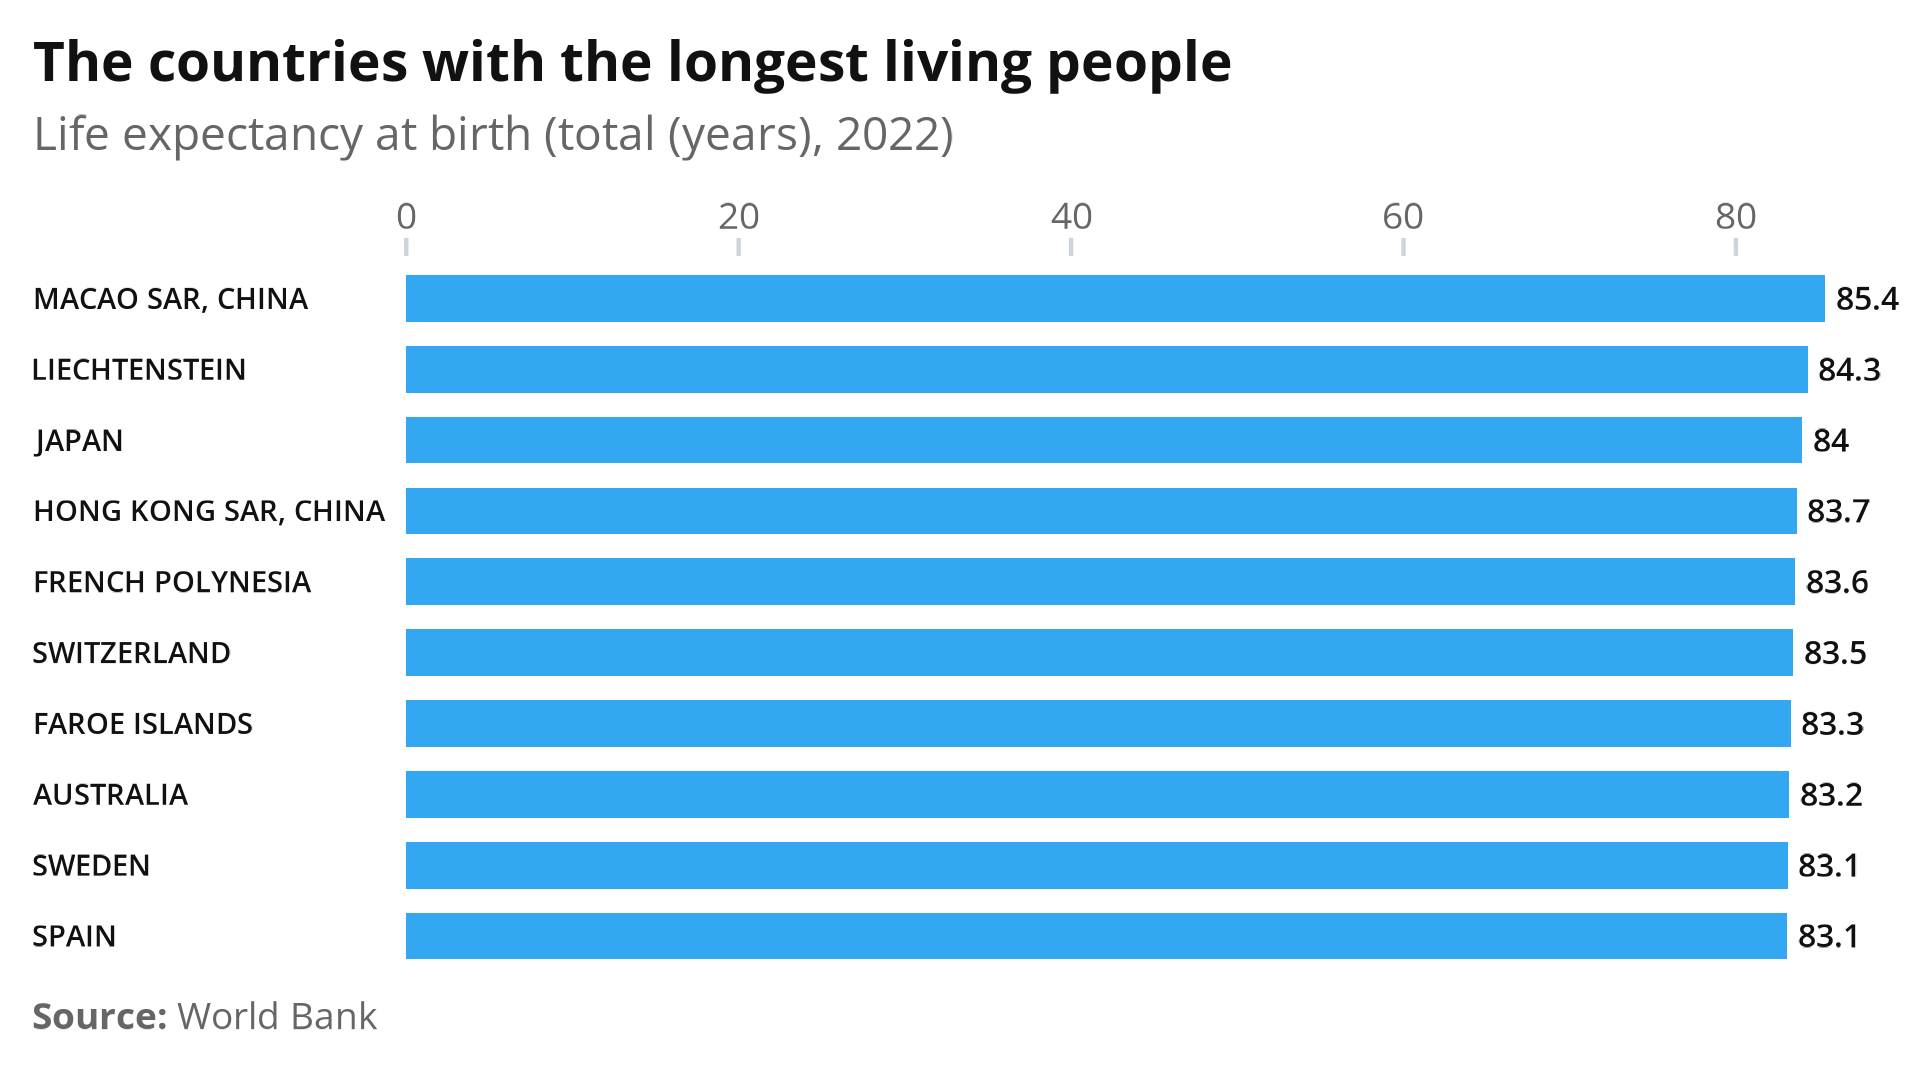
You can find the full documentation of the wbplot package in the readme, below you can find some more examples of visualizations with the World Bank ggplot2 theme applied.